The Technimental Take
Despite the rally today, the CBOE put/call ratio continues to run at above-average levels (1.10). That should help keep a bid under stocks.
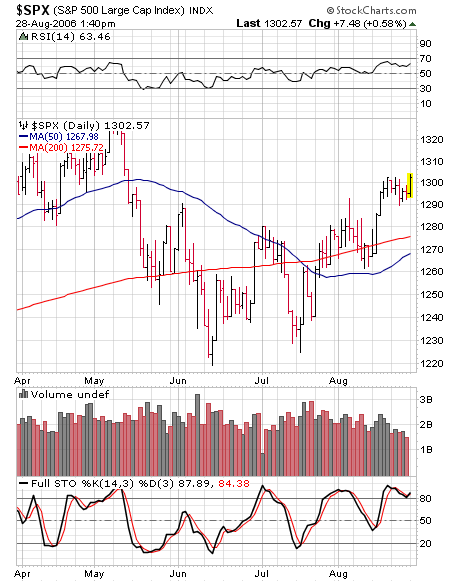
If you look at the daily chart above, you can see that the SPX is above last week's highs, as the counterintuitive rally continues. The market is in overbought territory, which could cap some of the upside. But sometimes, an overbought market moves to more overbought before pulling back.

I also included the weekly chart above, as it looks to be in good shape as well. As long as we hold these key moving averages on any future pullback, I think the market will remain in good shape for a strong year-end rally.
Here is a look at some highlights from the weekly sentiment indicators last week:
- The bull/bear spread on AAII bounced to +2. This ends a 14-week consecutive string of negative weeks, the 2nd most since the survey began in 1987. Nonetheless, this is still a very low level, as bearishness continues to run high.
- The Rydex Nova/Ursa ratio is still very low at .097; still lots of flows into bearish funds
- The 10-day average of the ISE Sentiment Index hit a new record low last week at 98; this is indicative of a lack of call buying, which emboldens my thesis that few are positioned for a continued rally
On a net basis, sentiment is still very negative. This is not how bull markets usually end. I still think that we get another strong leg higher, fueled by short-covering and led by growth stocks. The combined technical picture with the current sentiment backdrop suggests maintaining a bullish stance.
'
posted by J. Kahn @ 11:09 AM
0 comments
![]()
![]()


0 Comments:
Post a Comment
<< Home